Research Projects
Improving the Treatment of Subglacial Hydrology in the LANL Ice Sheet Model for Prediction of Future Ice Sheet Behavior and Sea Level Rise
 |
We propose to develop and apply an improved model of subglacial hydrology for dynamic ice sheet models. Ice sheet discharge to the ocean is dominated by fast flow in ice streams and outlet glaciers. Existing ice sheet models have limited predictive value, in part because they neglect key processes that determine the location and extent of fast flow. One such process is subglacial water transport, a control on basal sliding for grounded ice. We will develop and validate a new model of subglacial water transport, which will improve our ice sheet model’s ability to simulate the location and long-term behavior of fast-flowing ice streams. Combined with development efforts already under way at LANL, this innovation will result in more accurate simulations of the dynamic response of ice sheets to ocean and atmospheric warming. The improved ice sheet model will be incorporated in the Community Climate System Model, where it will be used for predictions of sea level rise on decadal to century time scales.
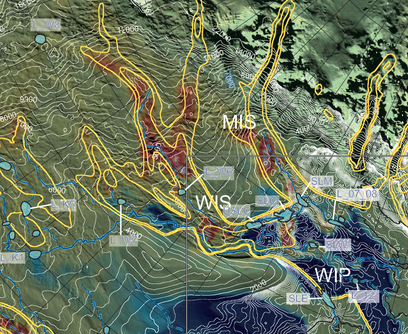
Figure: Basal melt rate, hydraulic potential , ice velocity, subglacial lake distribution and subglacial flow paths for the study area. |
Whillans Ice Stream Subglacial Access Research Drilling (WISSARD)
|
The overarching scientific objective of WISSARD is to examine the subglacial hydrological system of Whillans Ice Stream in glaciological, geological, microbiological, geochemical, and oceanographic contexts. Direct sampling will yield seminal information on these systems and test the overarching hypothesis that active hydrological systems connect various subglacial environments. These unique environments exert major control on ice sheet dynamics, geochemistry, metabolic and phylogenetic diversity, and biogeochemical transformations. Furthermore, the project aims to train a cohort of new young scientists in a setting of a multidisciplinary, integrated Antarctic science. WISSARD will promote scientific exploration of Antarctica by conveying to the public the excitement of accessing and studying what may be the last unexplored aquatic environments on Earth.
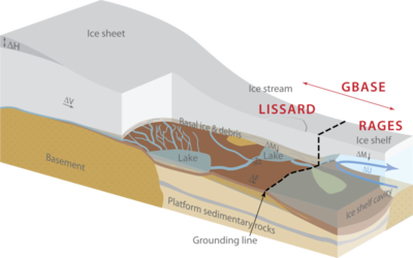
Figure: The glaciological, geological, and hydrological setting of the section of the Western Antarctic Ice Sheet to be studied by the Wissard program (image credit: Stefan Vogel). |
 |
Quantification of Mass Loss in the Ice Shelf Frontal Zone from Satellite Altimetry and Modeling
 |
Ice shelves play a major role in controlling the rate at which mass is lost from the grounded Antarctic ice sheet via its ice streams and glaciers. Ice shelf mass loss occurs through iceberg calving and basal melting. Calving may occur via large tabular icebergs (often 10s of km wide) associated with pre-existing rifts (e.g.,Lazzara et al. [1999]; Fricker et al. [2002]), or by “spalling” (frequent loss of much smaller pieces of ice through ocean erosional processes). We are interested in processes that cause mass loss in the Ice Shelf Frontal Zone (ISFZ), which we define as the swath, up to several 10s of km wide, along the ice front that exhibits enhanced interaction with ocean water from outside the sub-ice-shelf cavity. Our principal focus is on basal melting associated with ocean advective processes such as wind-forced and tidal flows.
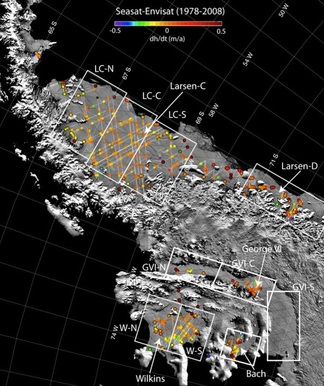
Figure: Derived rates of elevation change (dh/dt) on the Antarctic Peninsula ice shelves from inter-mission crossover solution: Seasat (1978) to late Envisat (2008). Background image for map is the MODIS Image of Antarctica. White boxes show the ice shelf regions used for averaging. The black lines are the Envisat ground tracks and the white lines are the Seasat ground tracks. The circles at the inter-mission crossover locations are color-coded according to their derived dh/dt rate. |
Low-relief Surfaces for Satellite Altimeter Performance Assessment and Geomorphic Process Investigations: Salar de Uyuni, Bolivia as Seen by ICESat, CryoSat and Other Satellite Sensors
|
This grant specifically funds ongoing calibration/validation of ICESat, with some support for cal/val and cross-calibration of altimeters such as Cryosat, ERS, and EnviSat. The primary calibration site used in this analysis is the salar de Uyuni, a large salt flat in western Bolivia whose optical properties are similar to that of ice and whose elevation was surveyed to within 2 cm RMS in 2002 using kinematic GPS. The smoothness of the surface and lack of relief at scales larger than a few meters makes the salar de Uyuni an ideal calibration surface for both range measurements and return waveform analysis. We use our knowledge of surface topography to assess ICESat performance under different conditions (e.g. varying cloud cover, low and high pulse energy, varying surface albedo) and to provide input and feedback into algorithm development focused on mitigating the impact of these effects.
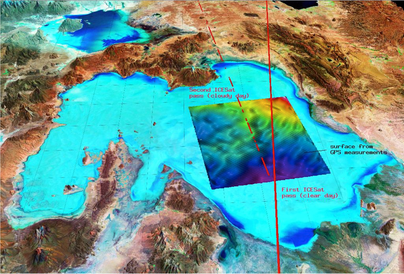
Figure: SRTM DEM in salar de Uyuni region draped over Landsat image. Our GPS surface is overlaid. ICESat Tracks 085 & 360 are shown. |
 |
Mapping Subglacial Water Movement in Antarctica with ICESat
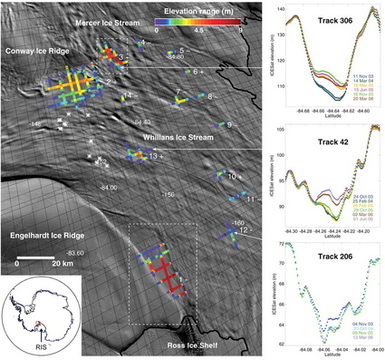 |
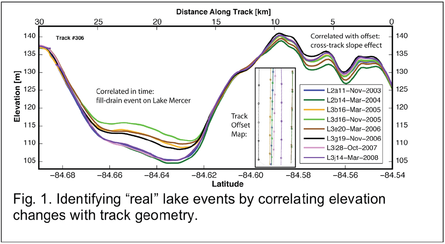
This project builds upon the discovery of an active sub-glacial water system under the Antarctic ice streams using repeat-track analysis of ICESat data, reported in Science in February 2007. Project goals are: 1) to map the spatial and temporal distribution of Antarctica’s “sub-glacial plumbing” system over a 5 year period (2003-2008) using ICESat data for the major ice stream systems of the Antarctic ice sheet; 2) to document subglacial lake activity over this time period 3) to understand the links between the subglacial water system and ice dynamics through synthesis of ICESat results with other satellite and field data.
Figure: Locations of elevation change events identified through repeat-track analysis of ICESat data. Straight black lines show the reference ground tracks and colored track segments show range in elevation amplitude for each elevation change event. Ice flow is from top left toward lower right. Background is MODIS Mosaic of Antarctica and inset map shows its location. Bold black line is the break-in-slope associated with the grounding zone of the Ross Ice Shelf. |
ICESat-II Science Definition Team: ICESat Repeat-Track Analysis Over Regions of Large, Variable Elevation Change on the Antarctic and Greenland Ice Sheets
|
There are two main objectives to this proposed work: (1) to investigate cross-track slope removal over rapidly-changing, variable, large elevation change regions; and (2) to determine the optimal footprint spacing and size over these surfaces for ICESat-II. Working with our collaborator Ted Scambos, we will use independent elevation data in three forms: (i) new, existing photoclinometric DEMs derived from MODIS-enhanced radar and laser altimetry elevations over the ice sheet interior (250 m resolution); (ii) planned image-derived DEMs ASTER DEMs from stereo-pair imaging of high-contrast ice surfaces such as outlet glaciers (15 m resolution) and; (iii) planned DEMs from stereo image pairs and stereo-pair data of selected regions from the Formosat-2 sensor (2 m resolution). These new and planned DEMs offer an opportunity for a clearer assessment of the regional cross-track slope over the West Antarctic Ice Sheet (WAIS) and the Greenland Ice Sheet (GIS), which were not available in previous assessments.
|
 |
An Investigation into the Seismic Signatures Generated by Iceberg Calving and Rifting
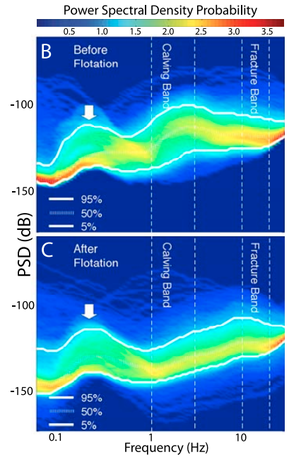 |
Primary goals: 1) To develop techniques for measuring ice fracture and iceberg calving rates using passive seismological observations from four different glaciological environments (Amery Ice Shelf, Ross Ice Shelf, icebergs B15 and C16 and Columbia Glacier); 2) To develop algorithms for classifying different “icequake” sources based on waveforms and their spectra; 3) To use similarities and differences in ice-related seismicity to learn about different ice fracture processes that occur within in each environment; 4) Determine which signals and which type of signals are visible in global observing networks (e.g. hydro-acoustic, infrasound, global seismic networks).
Figure: Probability density functions of power spectral density (PSD-PDF) for the continuous seismic record from station BBB near Columbia Glacier's terminus, acquired before (B) and after (C) terminus flotation, respectively. The white arrow marks the secondary microseism peak. |
